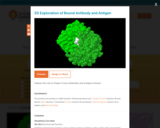
Explore the role of shape in how antibodies and antigens interact.
- Subject:
- Life Science
- Physical Science
- Material Type:
- Simulation
- Provider:
- Concord Consortium
- Provider Set:
- Concord Consortium
- Author:
- Concord Consortium
- Date Added:
- 05/14/2021

Today's learners, especially the most underserved, deserve to build strong futures in a complex world. We're dedicated to advancing STEM inquiry through technology to equip learners and empower lives.
Bring out the inner scientist in all your students with our scientifically accurate models and activities.

Explore the role of shape in how antibodies and antigens interact.
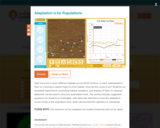
Deer mice live in many different habitats across North America. In each subpopulation, their fur coloring is a good match to their habitat. How did this come to be? Students run simulated experiments controlling habitat, predators, and displays of data. An optional datasheet can be used to structure quantitative work. The activity includes suggested questions for students to investigate, with particular attention to how the adaptation occurs solely at the population level, while natural selection operates on individuals.
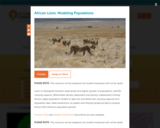
Learn to distinguish between exponential and logistic growth of populations, identify carrying capacity, differentiate density-dependent and density-independent limiting factors, apply population models to data sets and determine carrying capacity from population data. Make predictions on graphs and interpret graphical data to analyze factors that influence population growth.
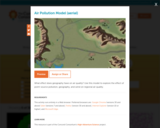
What effect does geography have on air quality? Use this model to explore the effect of point-source pollution, geography, and wind on regional air quality.
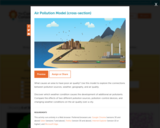
What causes an area to have poor air quality? Use this model to explore the connections between pollution sources, weather, geography, and air quality. Discover which weather condition causes the development of additional air pollutants. Compare the effects of two different pollution sources, pollution-control devices, and changing weather conditions on the air quality over a city.
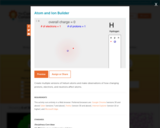
Create multiple versions of helium atoms and make observations of how changing protons, electrons, and neutrons affect atoms.
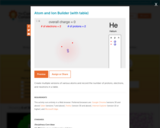
Create multiple versions of various atoms and record the number of protons, electrons, and neutrons in a table.
In this activity, students will explore how the Law of Conservation of Energy (the First Law of Thermodynamics) applies to atoms, as well as the implications of heating or cooling a system. This activity focuses on potential energy and kinetic energy as well as energy conservation. The goal is to apply what is learned to both our human scale world and the world of atoms and molecules.
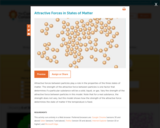
Attractive forces between particles play a role in the properties of the three states of matter. The strength of the attractive force between particles is one factor that determines if a particular substance will be a solid, liquid, or gas. Vary the strength of the attractive force between particles in this model. Note that for a real substance, the strength does not vary, but this model shows how the strength of the attractive force determines the state of matter if the temperature is fixed.

Modeling traffic data is important for urban planning, creating transportation systems, and even predicting how much foot traffic a retail store can expect in a given day. This genre of dynamic data science activities could be classified as “finding a needle in a haystack,” giving students a chance to mine big data to make insights about traffic use. According to the Bay Area Rapid Transit District, about 400,000 people used the BART system daily in 2018. In BARTy, students investigate BART data from 2015 to learn about passenger use and explore traffic patterns.

In this experiment, two chemicals that can be found around the house will be mixed within a plastic baggie, and several chemical changes will be observed.

This 26-page lesson plan, published in a partnership with the University of Wisconsin-Madison, Carolina Biological, and Concord Consortium, guides educators through teaching a lesson that accompanies "using Genetics with Data Science and Three-Dimensional Teaching". It describes lesson outcomes and they NGSS standards that align with them, as well as offers a formative assessment of student learning. In particular, this lesson plan covers engaging students in the phenomenon, using CODAP to analyze class data, and gamete formation, and offers examples of sample student work. For more information on how to implement this lesson, Infusing Genetics With Data Science and Three-Dimensional Teaching is available to view separately.
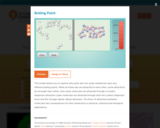
This model allows you to explore why polar and non-polar substances have very different boiling points. While all molecules are attracted to each other, some attractions are stronger than others. Non-polar molecules are attracted through a London dispersion attraction; polar molecules are attracted through both the London dispersion force and the stronger dipole-dipole attraction. The force of attractions between molecules has consequences for their interactions in physical, chemical and biological applications.
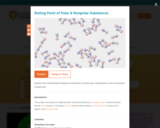
Explore the relationships between properties of molecules, temperature, and movement of particles.
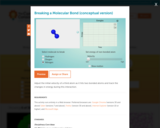
Adjust the initial velocity of a third atom as it hits two bonded atoms and track the changes in energy during this interaction.

Bridges come in a wide variety of sizes, shapes, and lengths and are found all over the world. It is important that bridges are strong so they are safe to cross. Design and build a your own model bridge. Test your bridge for strength using a force sensor that measures how hard you pull on your bridge. By observing a graph of the force, determine the amount of force needed to make your bridge collapse.

A bungee jump involves jumping from a tall structure while connected to a large elastic cord. Design a bungee jump that is "safe" for a hard-boiled egg. Create a safety egg harness and connect it to a rubber band, which is your the "bungee cord." Finally, attach your bungee cord to a force sensor to measures the forces that push or pull your egg.

A zip line is a way to glide from one point to another while hanging from a cable. Design and create a zip line that is safe for a hard-boiled egg. After designing a safety egg harness, connect the harness to fishing line or wire connected between two chairs of different heights using a paper clip. Learn to improve your zip line based on data. Attach a motion sensor at the bottom of your zip line and display a graph to show how smooth a ride your egg had!
Working with large datasets that support exploration of patterns is an essential first step in becoming fluent with data. In this dynamic data science activity, students can access part of the U.S. Census Bureau’s American Community Survey, containing demographic information about California residents (e.g., marital status, sex, place of birth, employment status, and health information). Students can try some of the suggested data science challenges, such as finding out the average income of Californians of different age groups in 2013, then engage in investigating their own questions.

Our agricultural system is made up of interconnected resources. The availability of these resources affects how much food we can produce. In this module, you will explore the resources that make up our agricultural system in order to answer the question: can we feed the growing population? Food production is faced with an ever-growing number of challenges. Growing enough food depends on the availability of resources such as arable land, sunlight, rain, and organic matter. Throughout this activity, you will explore land uses and soil quality through graphs of land use and crop production. You will run experiments with computational models to compare the effect of different management strategies on the land. You will not be able to answer the module's framing question at the end of the module, but you will be able to describe how humans can maintain and replenish important resources to be able to produce food long into the future.